AI-ranked stocksStraight answersZero hype
Every morning, see the market's top-ranked stocks — each with a clear score, the real reasons behind it, the risks, and the red flags. The full methodology stays out in the open.
No guarantees. No paid promotions. No personal financial advice — just ranked research, real risks, and the evidence behind every call.
Every breakout looks obvious — once it's over
Spot the setup before it's a screenshot.
Historical growth snapshots are shown for context only. Altoalpha helps you research ranked ideas with clear scores, real risks, and the reasons behind every call.
+730%
+532%
+524%
+254%
+182%
+174%
+730%
+532%
+524%
+254%
+182%
+174%
+730%
+532%
+524%
+254%
+182%
+174%
+730%
+532%
+524%
+254%
+182%
+174%
+730%
+532%
+524%
+254%
+182%
+174%
+730%
+532%
+524%
+254%
+182%
+174%
+180%
+167%
+124%
+98%
+95%
+51%
+180%
+167%
+124%
+98%
+95%
+51%
+180%
+167%
+124%
+98%
+95%
+51%
+180%
+167%
+124%
+98%
+95%
+51%
+180%
+167%
+124%
+98%
+95%
+51%
+180%
+167%
+124%
+98%
+95%
+51%
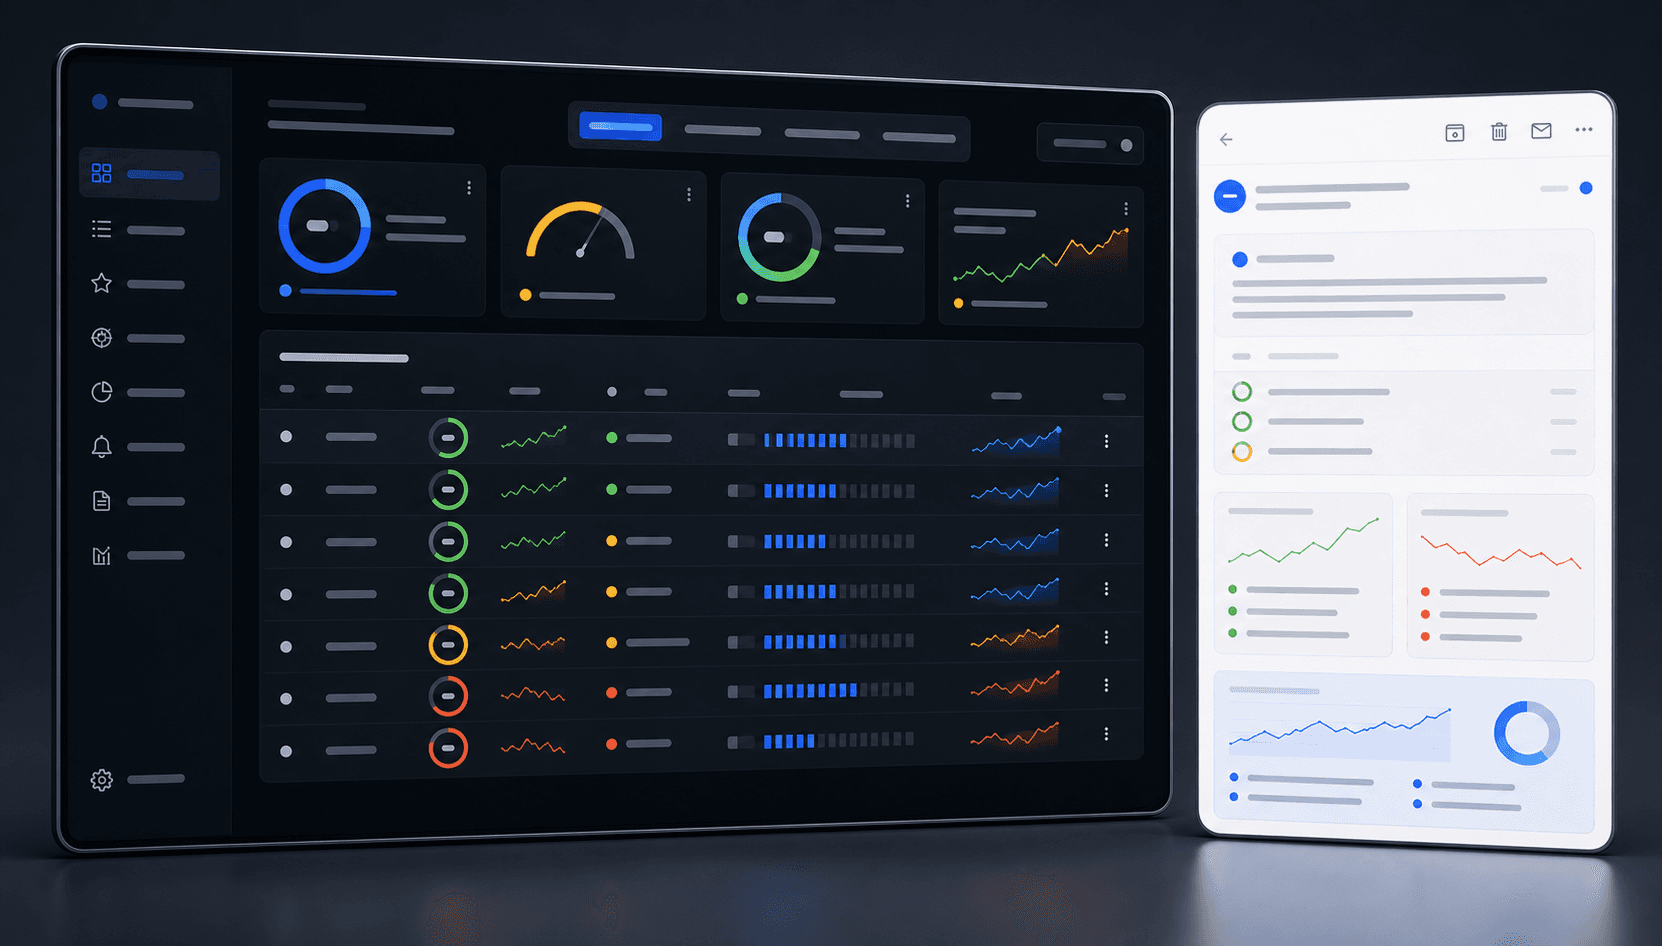
A quick look inside the member dashboard.
The pre-market brief, the live rankings screener, full scorecards, tagged news, and the Ask-AI research chat — exactly as members see them. Every pick's name stays blurred until you're in.
Names blurred on purpose — members see every pick, every morning.
Plays on a loop — no sound, no controls.
Rigorous research, made clear.
Altoalpha ranks US large- and mid-cap stocks across six core factors — momentum, trend, relative strength, volatility, drawdown control, and liquidity — then turns the results into clear, balanced research notes anyone can understand.
Built on hard data
A rigorous quantitative model scores every stock from real market data — disciplined, repeatable, and free of guesswork.
Explained, not just scored
Advanced AI turns those factor scores into balanced summaries — strengths, risks, and red flags — with no hype and no jargon.
Transparent by default
Methodology, limitations, disclosures, and full performance tracking — including the misses — are open from day one.
Launch with the paid brief and dashboard.
Founding members get the full daily brief and dashboard for $99 the first year — over 70% off the $350 annual price. Once founding access closes, the rate returns to $350/year for everyone.
Altoalpha
$99
$350
for your first year, then $350/year
Limited founding offer — lock in $99 before the price returns to $350.
Get the free market brief.
Use the free list to build trust before subscribing. Paid members receive the full daily rankings, scorecards, and performance tracker.